Why visualization?
Visual Arena is a neutral innovation platform under Lindholmen Science Park's program portfolio that initiates and runs projects that respond to complex problems. Our tools to achieve insights and results are visualization, curiosity and creativity in our experimental innovation and design approach and meet answers and solutions that matter most to society, organizations and individuals.
You as an organization can come here with your or society's challenges, in an innovation project where we bring together several experts, we seek answers to the challenge. Are you curious and want to know more? Contact us
Visualization is a way of communicating, a tool that enriches our way of expression and helps us to understand and experience.
By developing and using visualizations, we can simplify and illustrate contexts that are hidden in large amounts of data or are beyond the capabilities of our senses.

A way to communicate
Visualization is a way of communicating, a tool that broadens our ability to describe and helps us understand and experience.
Examples of valuable effects visualization can have:
- bridging barriers
- simplifies and clarifies
- creates power for change
- illustrates the thought and the measured
"The best way to get high bandwidth between a human and the computer is to use visualization"
Anders Ynnerman Visual Forum 2020
Our expert skills
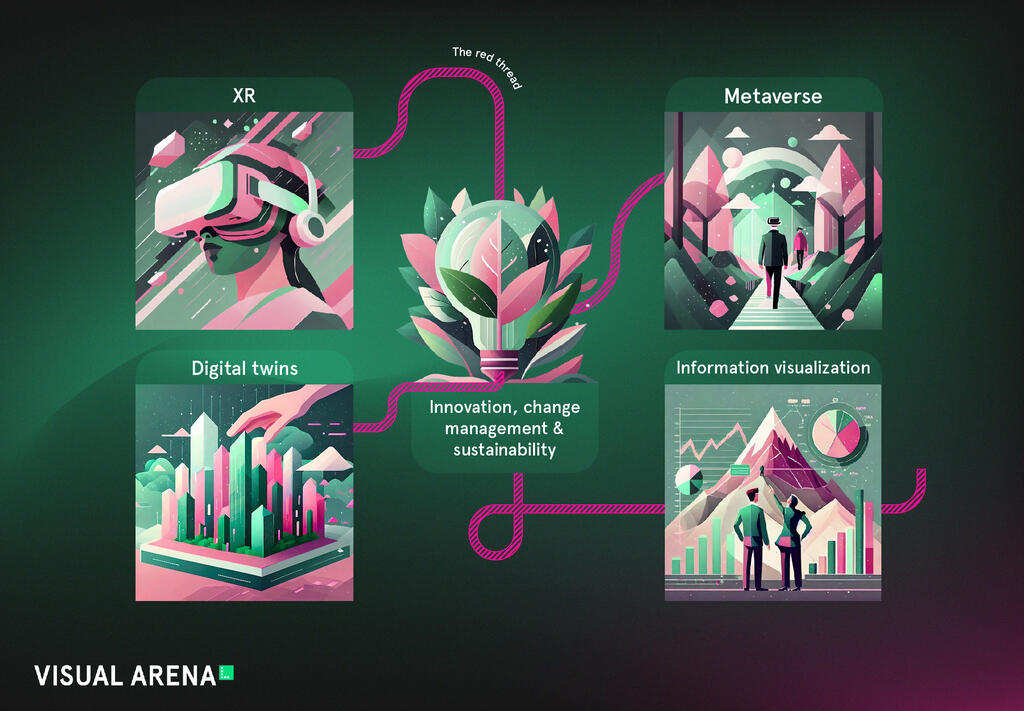
Discover our innovation projects where we use visualization as a tool to meet challenges

Digital twin for circular food systems
Norm-critical visualisation – preliminary study

Sustainable home development via increased MIK
Architectural Visualization Day
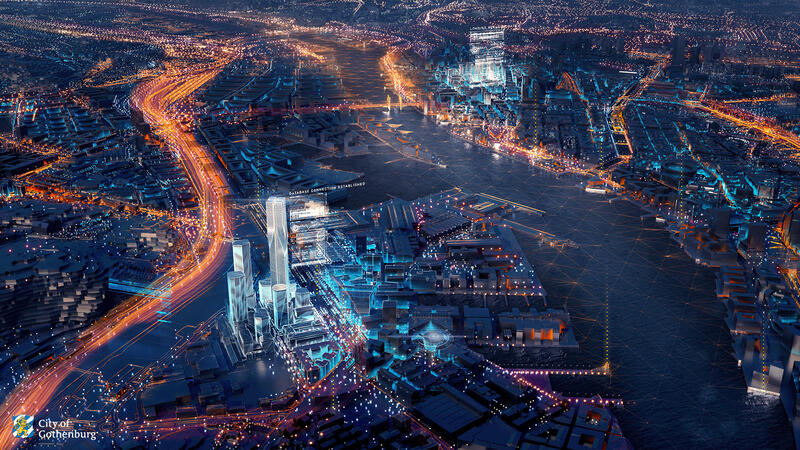
Climate neutral Gothenburg 2030
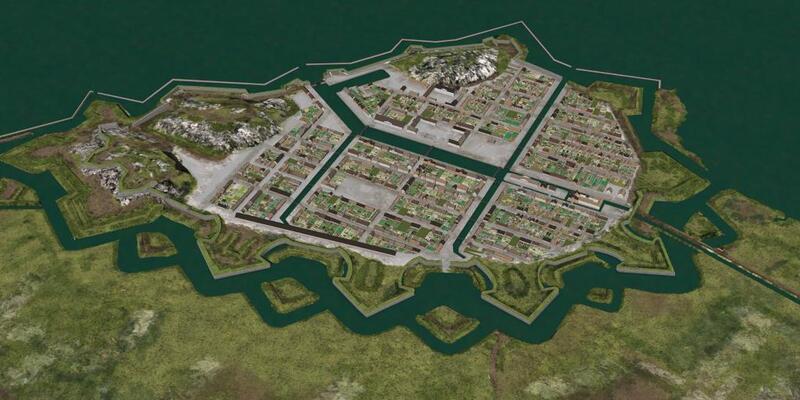
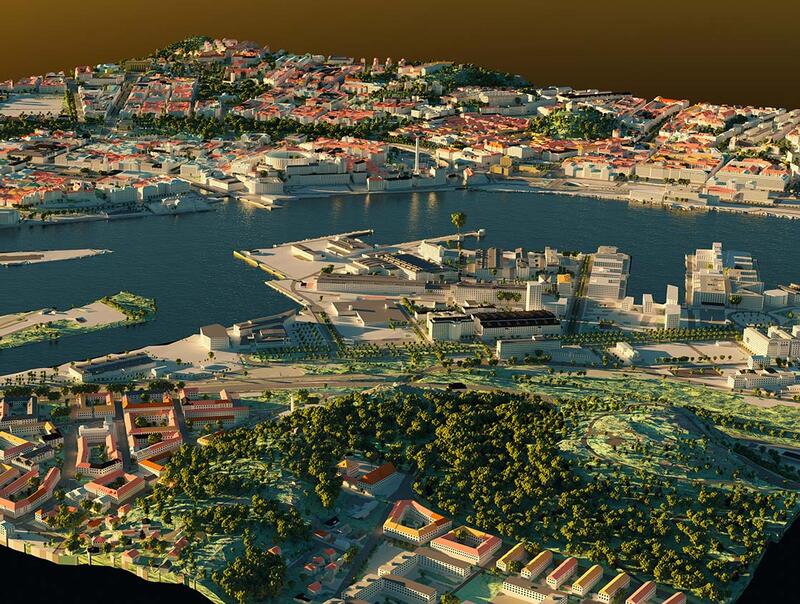
Digital city model 17th century
Digital Twin Cities Centre
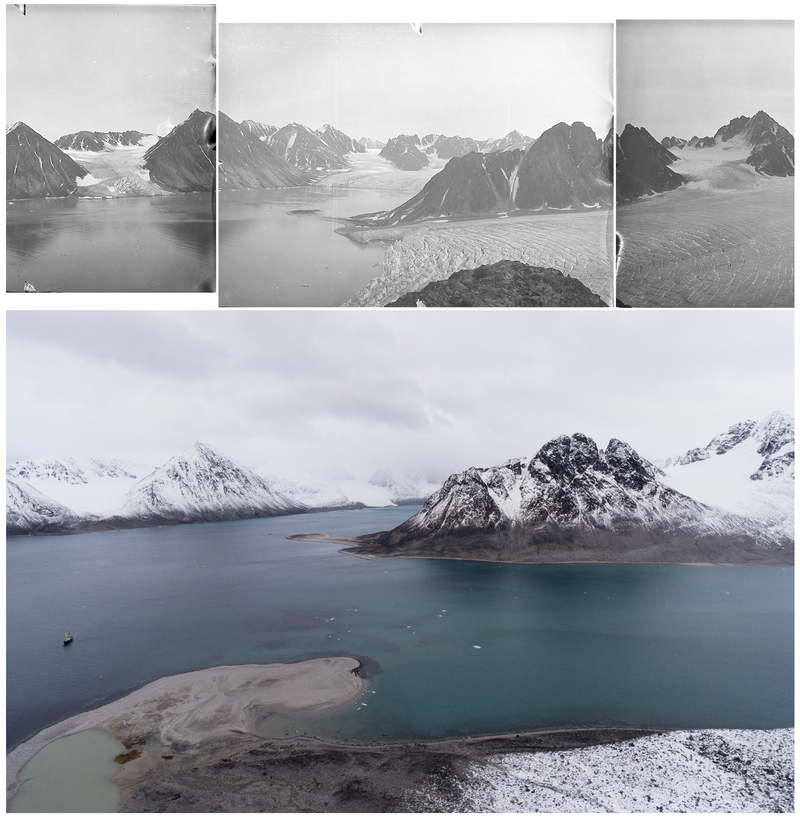
Expanded rephotography
Experience to Insights Lab
Fewer stereotypes when the cities of the future are visualised

Framework for unique test bed
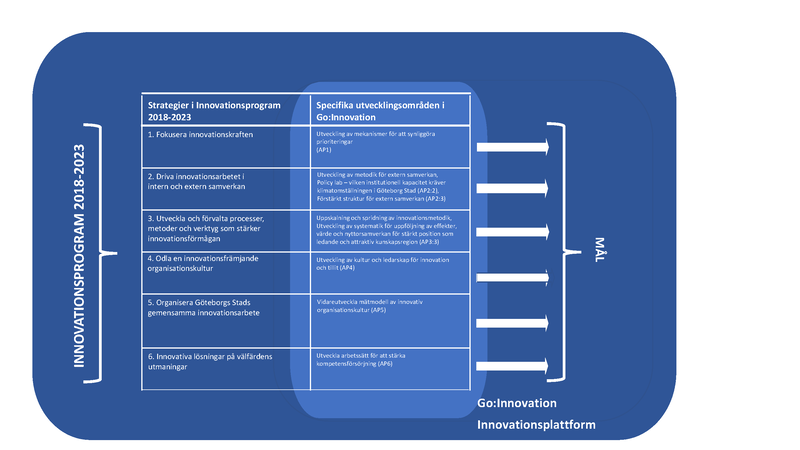
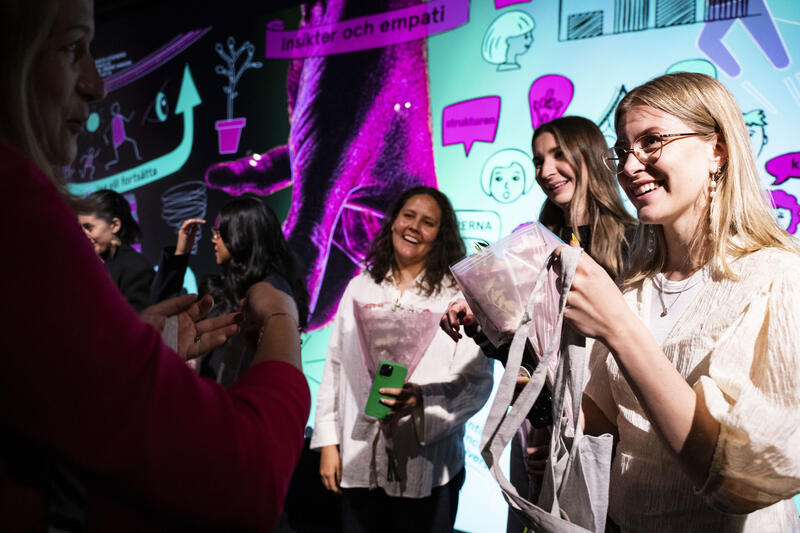
Go:innovation fas 3
Go:smart

Methods for digital diagnosis of endangered cultural heritage

Monki R&D
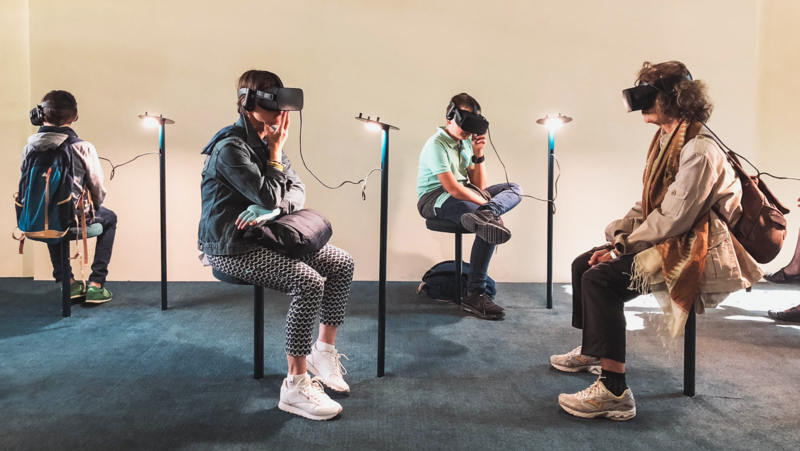
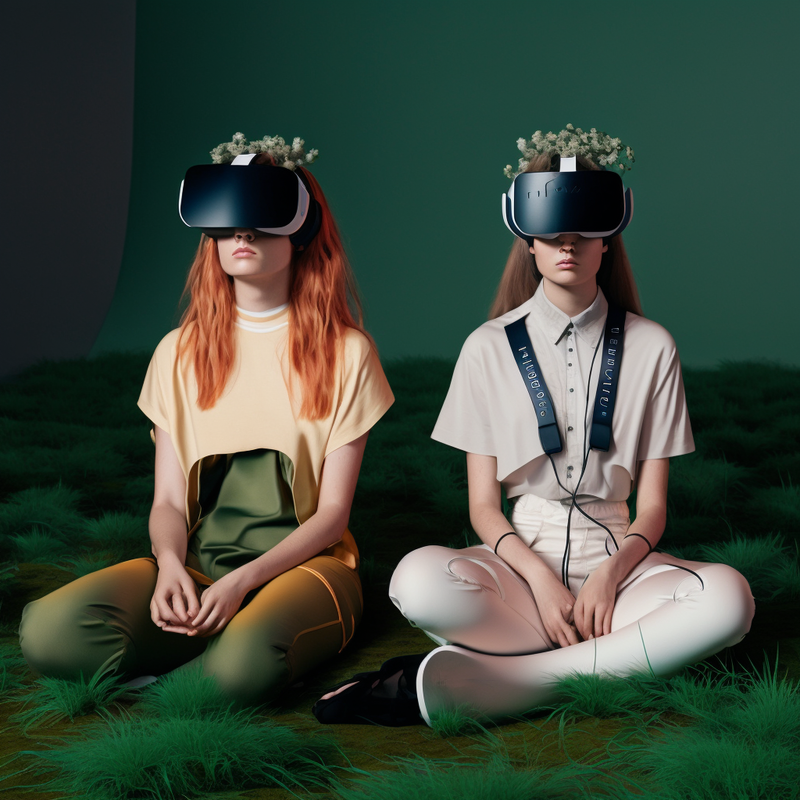
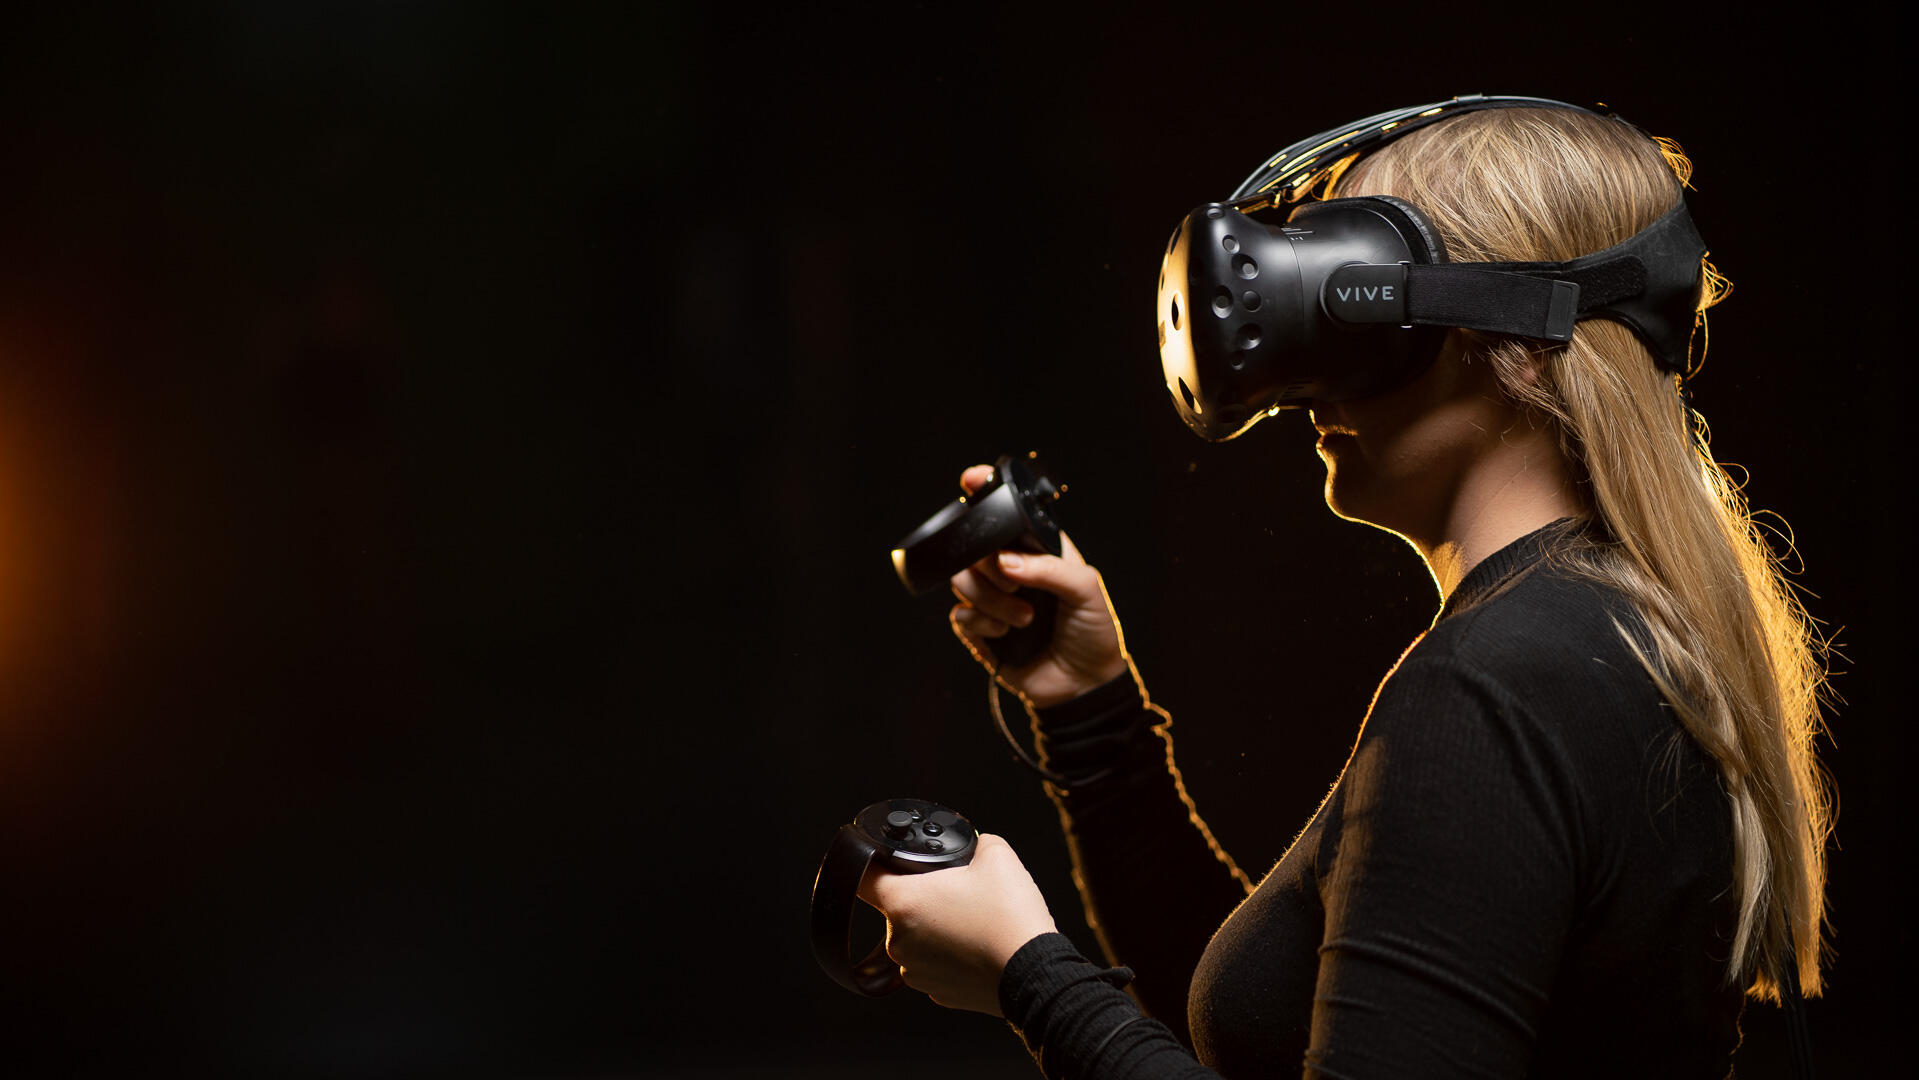
Narrative VR Lab

Narrative VR Lab 1
Narrative VR Lab 2
Narrative VR Lab 3

Narrative XR Lab
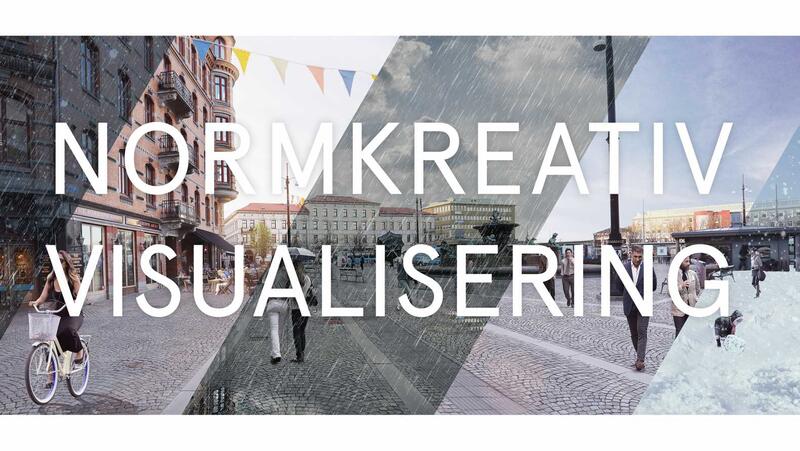
Norm-creative visualization in urban development

Operaverse
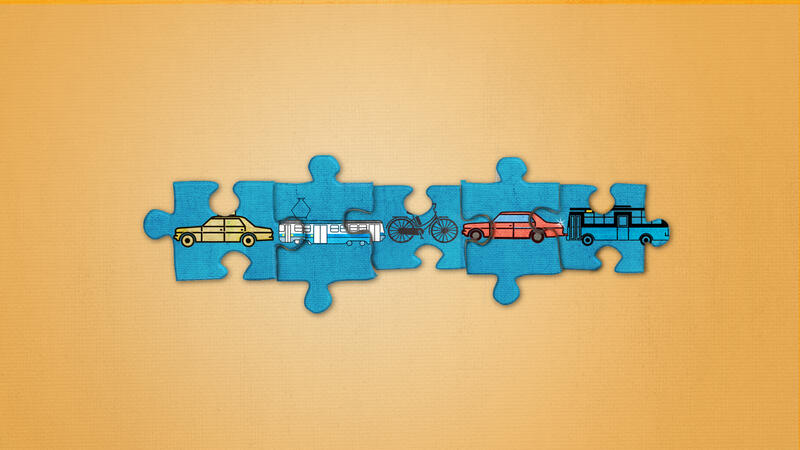
REATE Comprehensive REAlistic Transportation system Emulation
Benefits and effects
By developing and using visualizations, we can simplify and illustrate contexts that are hidden in large amounts of data or are beyond the capabilities of our senses. Many research fields today are dependent on these powerful and interactive visualizations, and large community building projects are today unthinkable without visualization if citizens are to be able to participate in the democratic process. It is important not to stop without further developing our knowledge of visualizations as it provides increased opportunities to effectively analyze and visualize data sets that can contribute to crucial explanations of complex relationships and abstract theories. Through such a process, visualization can contribute to increased societal benefits, new opportunities for innovation, a concrete collaboration between research, companies, organizations, authorities and the general public.
Contributes to innovation and democracy
Visualization was recognized as a scientific discipline more than 30 years ago, and since then the research community has been relatively unanimous about the definition and significance of what visualization means. Simply explained, visualization means an illustration of complex, multidimensional, contexts through expressions that are adapted to the human sense of sight. Visualization can take place, for example, through images, diagrams, simulations and animations. A more academic definition is: the use of computer-supported interactive, visual representations of (abstract) data to amplify cognition.
Visualization is an area under very strong expansion, where increased insights into the benefits of communicating with the help of images go hand in hand with the increased technical possibilities of creating interactive and dynamic visualizations. By developing and using visualizations, we can simplify and illustrate contexts that are hidden in large amounts of data or are beyond the capabilities of our senses. Many research fields today are dependent on these powerful and interactive visualizations, and large community building projects are today unthinkable without visualization if citizens are to be able to participate in the democratic process. It is important not to stop without further developing our knowledge of visualizations as it provides increased opportunities to effectively analyze and visualize data sets that can contribute to crucial explanations of complex relationships and abstract theories. Through such a process, visualization can contribute to increased societal benefits, new opportunities for innovation, concrete collaboration between research, companies, organizations, authorities and the general public.
We constantly use visual information to control our motor skills and to gather information. As soon as the light hits the retina, a process starts in the brain to interpret what we see and draw conclusions about how we should act or react. Therefore, visual information is very important when interacting with the outside world and when transferring knowledge.
Better decisions based on visualization
Through visualization, different individuals can get the same picture of a plan or event. It makes it possible to communicate across barriers such as gender, culture and age. However, it is important to understand that visualization can also be deceived. You can also make nice visualizations of bad or incomplete data, so do not forget to be source critical when looking at visualizations.
Thanks to the rapid development in hardware and software, we have also become better at understanding how our vision actually works, how we humans interpret and analyze images. The core of visualization is that we try to divide the workload between computer and people. Computers count quickly and correctly, and humans are good at seeing context and analyzing images, which can lead to better decisions. Therefore, visualization is important in many areas. Visualization creates an opportunity for several actors to see the same thing in front of them. One has e.g. seen clear gains in time efficiency in terms of decisions about construction when going from 2D to 3D drawings in the decision process.
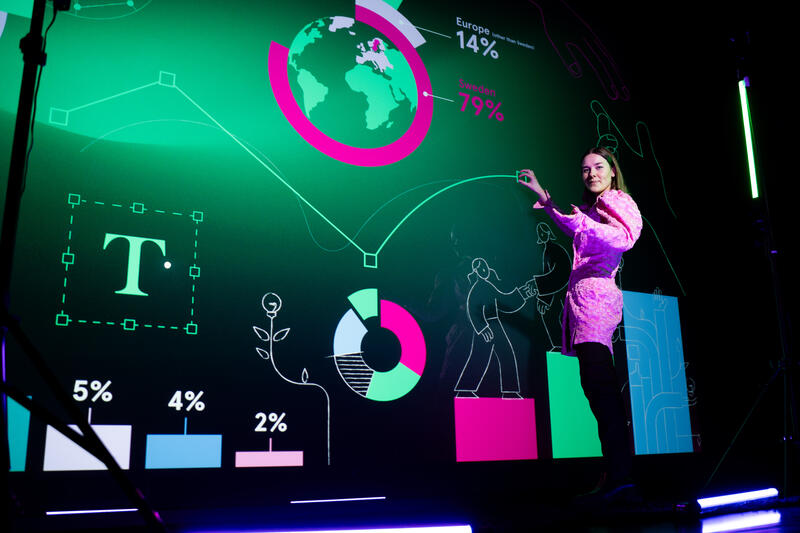
A visualization can be a hand-drawn sketch or an image created with a computer program. When it comes to making large amounts of data comprehensible, different forms of diagrams or maps are used, and then we talk about information visualization. Visualization is used, among other things, to explain planned changes in the urban environment, statistical relationships and medical interventions. It is an important tool with great democratic and pedagogical potential.
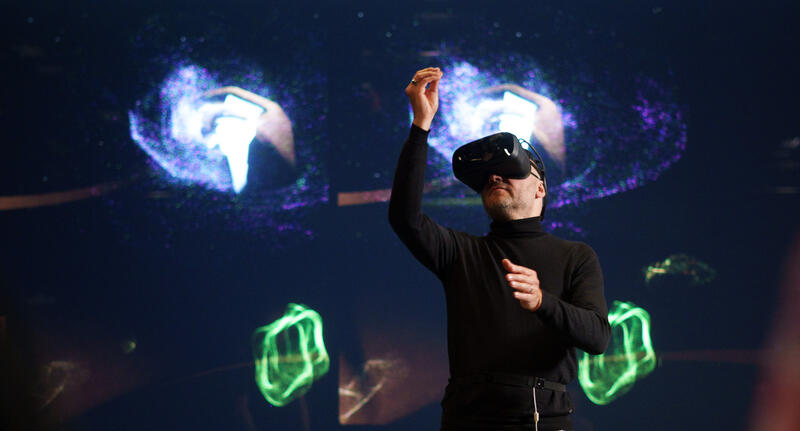
With today's powerful computers, it is possible to create spectacular visualizations. You can travel into the human body and make exploration trips to other galaxies or down to the depths of the sea.
The need to show and illustrate information to others has existed as long as there have been people. From early cave paintings in southern Europe via the first maps to today's visualizations of complex information in various fields such as medicine, geography and computer science.
Want to know more about visualization?
We have a unique network and broad expertise in the field of visualization. Visualization is used today in many different industries such as healthcare, urban planning and computer science. Contact us for more information.


Event där visualisering möter brännande utmaningar
The sustainability reporting of the future is visual and spelled CSRD!

Visual Arena Spektrum – An experience of the power of visualization
Explore Virtual Worlds Event Series 2

Explore Virtual Worlds event series 3